Hyper-V Performance Monitoring and Optimization
This article will guide you about how to effectively use Hyper-V performance monitor and maintain your node performance. We've frequently seen that many server administrators, when they start receiving performance alerts, they start migrating Virtual Machines to other nodes. This is not the right solution always.
In the case of alerts, Hyper-V performance monitor tool can be very helpful. In the performance monitor, please start looking at Hyper-V Logical Processor and Hyper-V virtual processor counters.
Hyper-V Logical processor - Total Run time
Hyper-V Logical processor is useful to measure actual CPU usage on the server. When there is a performance issue, most of the techs will start looking at task manager. Please note that Windows task manager does not show the actual CPU usage. To view actual CPU usage, look at the Hyper-V Logical processor by following steps:
- Click on Start Button.
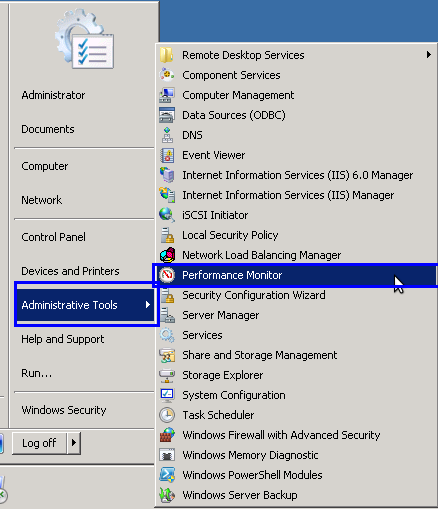
- Go to Administrative Tools and select Performance Monitor.
- Now expand the hyper v Monitoring Tools option and select Performance Monitor.

- By default, this window will explain you the actual %Processor time.
- To see Total Run time of Logical Processor, click on Add (+) icon.
- A new Add Counters Window will be displayed on the screen.
- Now select HyperV server from the drop down list. If you can not find the server in the drop down box, click on Browse button ... and search for appropriate server.

- After selecting appropriate server, select Hyper-V Hypervisor Logical Processor option from list and click on + icon to view the sub options.

- Now select % Total Run Time option and click on Add>> button.

- You will see % Total Run Time option is added in Added Counters list.
- Now click on OK button to monitor Total Run time of the Logical Processor.

- You can see the graph for this. By double clicking on particular option from the bottom, you can change line color and size.

- If Total Run Time is Less than 60%, your CPU usage is in Healthy state.
- If it is between 60% to 89%, your CPU usage is in Monitor or Caution state.
- However, if you found that it is above 90%, it is in Critical state and the performance of the server will be adversely affected.
If your HyperV is in situation 3, you need to check for the high usage VMs on that HyperV node.
Hyper-V Virtual processor - Guest Run time
This performance counter will help you to find Virtual Machines consuming the most CPU resource. To determine which virtual machines are consuming CPU, perform following steps :
- Click on Start Button.
- Go to Administrative Tools and select Performance Monitor.
- Now expand Monitoring Tools option and select Performance Monitor.
- By default, this window will show you the actual %Processor time.
- To see Total Run time of Logical Processor, click on Add (+) icon.
- A new Add Counters Window will be displayed on the screen.
- Now select HyperV server from the drop down list. If you could not find the server in the drop down box, you can click on Browse..button and search for appropriate server.
- After selecting appropriate server, select Hyper-V Hypervisor Virtual Processor option from list and click on + icon to view the sub options.
- Now select % Guest Run Time option.
- From Instances of selected Object list, select
option to see the graph of all VMs. - Click on Add>> button.

- You will see % Guest Run Time option is added in Added Counters list.
- Now click on OK button to monitor Total Run time of the Guest Processor.

- You can see the graph for this.
Now identify the VMs which are consuming high CPU. You can know the VM name by moving mouse arrow on particular graph line. Once you get VM names, you can login to those VMs to check if there is any unusual activity or something else is running on that VM or not.

From task manager we have to check high CPU usage processes of that VM. In most cases there should be some issue with those services. There is no fix pattern to troubleshoot such issue. we have to act depending on the situation, If required we can also restart the service which is consuming high CPU.
Following video demonstrates how to create performance view of a Hyper-V environment :
Note: Kindly add counter under Monitoring tools -> Performance Monitoring. Never use data collector counter since it saves the data in files and it will fill up C: drive quickly if you have selected large number of counters.
FAQs
What is Hyper-V monitoring?
Hyper-V monitoring is the process of tracking the performance and resource usage of a Hyper-V host and its virtual machines. It helps administrators monitor CPU, memory, disk, and other resources to identify performance issues before they affect workloads.
How do I monitor Hyper-V performance in real time?
You can monitor Hyper-V performance in real time using Windows Performance Monitor. Add Hyper-V counters such as Hyper-V Hypervisor Logical Processor and Hyper-V Hypervisor Virtual Processor to track CPU usage on the host and individual virtual machines.
How do I track resource usage on Hyper-V hosts?
Use Windows Performance Monitor to track resource usage on a Hyper-V host. You can add Hyper-V performance counters to monitor CPU utilization and identify virtual machines consuming excessive resources.
What is VM performance monitoring in Hyper-V?
VM performance monitoring involves tracking the resource usage and performance of individual virtual machines running on a Hyper-V host. Hyper-V Performance Monitor counters can help identify VMs that are using unusually high CPU resources.
What is Hyper-V performance monitoring?
Hyper-V performance monitoring involves measuring the performance of a Hyper-V host and its virtual machines using built-in Windows performance counters. It helps administrators identify CPU bottlenecks, high-resource VMs, and other potential performance problems.
What are the best ways to monitor Hyper-V virtual machines?
The best approach is to monitor both the Hyper-V host and individual VMs. Windows Performance Monitor can be used to track Hyper-V logical processor and virtual processor counters, helping you identify overall CPU usage and VMs with high CPU consumption.
What are the leading Hyper-V monitoring best practices?
Start by monitoring the Hyper-V host and individual VMs separately. Track CPU and other important resources regularly, investigate sudden increases in usage, and identify the VM or workload responsible before moving VMs to another host.
How can I monitor Hyper-V performance in real time?
Windows Performance Monitor provides real-time graphs for Hyper-V performance counters. You can add counters, such as % Total Run Time for logical processors and % Guest Run Time for virtual processors, to monitor CPU usage while the system is running.
How do I identify high resource usage on a Hyper-V host?
Use Hyper-V Performance Monitor to check host-level resource usage and then examine the performance of individual virtual processors. If a VM shows consistently high CPU usage, investigate the processes and services running inside that VM to determine the cause.
About the Author: Rahul Vaghasia
Rahul is CEO at AccuWebHosting.com. He shares his web hosting insights at AccuWebHosting blog. He mostly writes on the latest web hosting trends, WordPress, storage technologies, Windows and Linux hosting platforms.
Short one since this keeps clearing. Why _Total % Guest Run Time less than any individual %Guest Run Time?